This topic contains 5 replies, has 4 voices, and was last updated by ![]() Y_ 3 years ago.
Y_ 3 years ago.
- AuthorPosts
Update – Indian Banking Crises Part 2
Hello everyone. I intended close the post in here but realised there was too much material to do justice to the topic. I will concentrate on the Indian Real and Shadow Economies in Part 2 and hopefully conclude the post in Part 3. See how we go. You can read Part 1 here
3. The Indian Economy – Causes and Consequences
Pre-independence India depended mostly on agricultural production, mining and raw materials under the British Colonial Era for its Gross Domestic Product (GDP). This period of India’s past directly influenced each sector’s growth and decline post-1947 after independence.
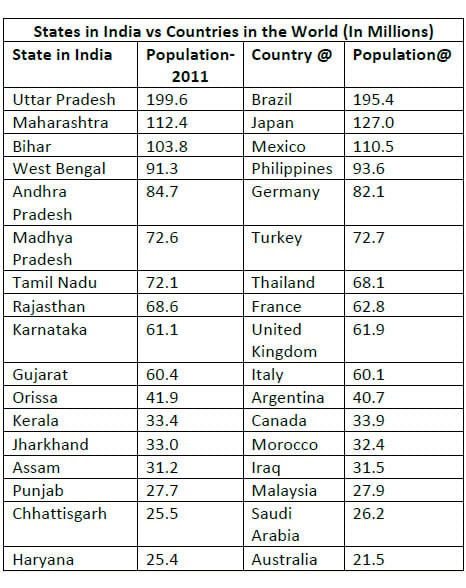
It is important to understand the scale of India in terms of population. Here is a size comparison chart. It will become evident that India can provide GDP data that can incorrectly show India is healthy – which is actually based on the work of a minority of the workforce even though the majority is suffering
http://www.medindia.net/health_statistics/general/images/population-indian-states.jpg
I will talk a bit about the overall economic data usually quoted for India and claimed as healthy. A quick look at the Current Account (nett external debt) as a percentage of GDP shows that India has consistently operated a current account-deficit (CAD).
Current Account (CA) is the net of all exports, imports, services, dividend/interest and transfer payments between a country and the world that have occurred during a year. The CA divided by the GDP is the CAD.
CA can also be interpreted as the difference between Forex or National Savings (Exports) and Foreign Investments (imports). India has accumulated Forex reserves worth nearly 360 Billion USD in 2016, which can fund imports for six months.
The deficit adds up to the country’s foreign debt and is repaid in a number of ways. In 1985, India paid off part of its foreign debt in physical gold.
CAD is also seen as a necessary feature of a developing economy such as India, as there is higher need for investments in the form of imports compared to mature economies. At the same time, high CAD is known for systematically undermining economic stability if not checked.
Maintaining CAD at a sustainable level is a primary concern, A CAD of 1.4% to 2.0% of GDP has been proposed as a sign of a healthy growth in the economy while running a deficit that is practically repayable.
In 2016 the GDP was INR 142 trillion, CA was INR 0.23 trillion – giving a CAD of 0.23/142 x 100 = 0.16% which shows a lower proportion of imports to exports than expected (at 2% of GDP). We will see if this is a good sign or not.
CAD is due to the operation and contribution of all the three main sectors – agricultural, manufacturing and services. However, contribution of CA by sector has not been considered in India’s GDP. This approach used by emerging economies is incorrect.
The CA is assumed to come from a proportional contribution by each sector to maintain a balanced growth model for the entire economy. Without this underlying assumption CAD can give incorrect or false conclusions – as in the case of India.
We will look at the contribution of the three different sectors – agricultural, industrial and services (including IT) on GDP. The growth and size of each sector must be proportional to its contribution to GDP.
At the same time we need to see whether the sectors are healthy in terms of worker wages, inflation and debt.
Below is a chart showing the relative percentage contribution of each sector. We shall look now at each sector in turn.

<<I will look at currency and wages in INR Indian Rupees (USD $1 = INR 70) and give a frame of reference for living wages.
As a minimum wage, INR 50 / day or INR 20 000 / year is required for a singe person. A family of 4 can survive on INR 150 / day or INR 55 000 / year. The actual minimum for a decent existence is about INR 500 / day or INR 180 000 / year. Anything above this is ‘middle class’.>>Agriculture
Although currently self-sufficient in food products, India is facing a crisis from diminishing food supplies due primarily to neglect of this sector. Agricultural and fishery assets are a major political time-bomb and the sector was left largely unchanged as being too hard to fix and not important enough to be cared about.With a proportion of 14% of GDP to 53% of the total workforce, it is the backbone of Indian subsistence and India is 100% food sufficient, employing the masses that have no other alternative work prospects in India. A culture of indifference to the plight of this sector continues to this day. In terms of wages, the agricultural sector famiiy earns about INR 185 (USD $2.7) per day or INR 67 000 per year as an average. About 20% live below the poverty level of INR 85 (USD $1.25) per day
The industrial sector that comprises 27% of GDP employs 22% of the workforce and is a consequence of legacy industrialisation.
Industry
Petroleum crude and oil-based products (that includes 80% of India’s oil) have been driving the imports and have risen by 22% in the past 5 years. Additionally from 1987 the value of non-petroleum import goods have increased by nearly 27-fold but major exports have only increased by 20-fold.Gold and silver have been contributing to the rapid increase in non-bulk imports as well – however these are considered as financial reserves not liabilities and are a major wealth item in every Indian household.
After liberalisation (1990 – ) India unfortunately tried too late in international markets to compete successfully with the European Union and China in the majority of important export areas, and the Indian agricultural and industrial sectors became primarily about meeting internal demand and maintaining limited export quotas in GDP.

The relatively high cost of investment with low returns and high capital risk (product quality, labour strikes, lack of proper infrastructure and a legal and taxation minefield) deters local and international investors and has seen the takeover of industry by large local monopolies which stifle competition.
These sectors are kept running through bank loans but with little improvement on worker suffrage or product quality. There are limited success stories in automotive products but this was more a production facility planned and paid for by Japanese and Korean car manufacturers with limited leverage to the Indian co-owners.
For the industrial and manufacturing sector, import substitution seems the only credible way for permanently tackling CAD as well as by investing in alternative energy projects.
As an important example, the Indian steel industry is unable to compete in world markets when China post-2010 began dumping steel worldwide to stave off a currency devaluation crisis. It has been approximated that China produced more steel in one year than the British Steel Industry did over the last one hundred years.
Investment bank Credit Suisse estimates that the INR 350 billion of debt in the books of the major steel companies is around 15 times their collective operating profit as nett GDP in fiscal year 2015. The sector has been allowed to continue borrowing from banks and is provided state or federal help to fund operations. In terms of wages, a family in the industrial sector earns about INR 370 (USD $5.5) per day or INR 135 000 per year.
http://delhi.gov.in/DoIT/DOIT_Labour/wage_graph1.JPG

Services and IT
The crises with both agricultural and manufacturing sectors is self-perpetuating – lack of funds to modernise create deficits that cause investment funding to be channelled into the services sector and in speculative banking activities with a proportion of 59% of GDP to 25% of the workforce. India was fortunate in that a global IT services and business process outsourcing (BPO) boom centred on its youth emerged in the 1990’s.Championed by the Andhra Pradesh Chief Minister Narasimha Rao, the IT sub- sector currently controls almost 8% of the GDP but employs 2.5% of the workforce (or 11 million people) in specific cities associated with IT development such as Hyderabad, Bangalore and Chennai. This sector also employs about 7.5% of the construction workforce. Massive bank loans to both commercial and residential borrowers in this sector are still outstanding but are logged as performing assets (PA) at this point in time.
The industry’s share of total Indian exports (merchandise plus services) increased from less than 4% in 1998 to about 25% in 2016 classed in the chart below as ‘Others’. The non-IT services make up 22% of the workforce for 50% of GDP. In terms of wages, the IT services sub-sector earns about INR 1700 (USD $25) per day or INR 600 000 per year, while the services sector in general earns about INR 400 (USD $6.0) per day or INR 146 000 per year. This is India’s real ‘Middle Class’ at about a 110 million people or 10% of the population.

So – what exactly is the problem in India – is the GDP telling the truth?
In a country like India, where the service sector comprises nearly 60% of the GDP, this is a sign of an extremely unbalanced economy. This sector drains away the investments and attention from other hard-asset and potential wealth-producing sectors, and is the major cause for inflation and as an interest rate setter. The wealth creation is therefore non-existent for the remaining 75% of the working population but the effects of inflation are felt more keenly.
This skew is a source of economy instability. A structural collapse of the underlying financial system is a possibility.
Discounted Workers
In India, bonded (slave) labour is a forced relationship between an employer and an employee, where the compulsion is derived from outstanding debt. Often the interest accrues at a rate that is so high that the bonded labour lasts very long periods of time, sometimes indefinitely. A 1978 estimate placed bonded labour in India to be 2.62 million or 0.5% of the labour force. This is labour that does not go into production costs and therefore produces cheap goods.
Inflation, Wages and Education
Let us consider the effects of inflation (which is an increase in the currency supply) on wages. Based on the data from the Reserve Bank of India (RBI) the following chart shows historic inflation in India:
http://www.inflation.eu/images/charts/infl-chart-3-1-56.jpg

The inflation rate accelerated from an annual average of 1.7% during the 1950’s to 9.0% in the 1970’s (when fiat money printing started), and currently expected at 5% in 2017. The increase in Indian wages year-on-year is about 5% for agricultural/manufacturing and 10% for services Again the services sector is the only area where real wages are increasing relative to inflation.
Let us look at the wage structure based on households and education to see how many are in financial trouble as a result of a lack of education.
In about 5% of the households, there are no workers. About 46% of the households have a single worker. In about 78% of households, there are no salaried persons.
A majority of 32.6% of the population is not educated to a primary school level, followed by 25.2% to primary (6 -14 years), 15.7% to middle (11-14 years), 11.1% to matric (14-16 years), 8.6% to higher secondary (16-17 years) and 4.5% to a graduate level. This directly affects their employment and economic status.
The education and skilled labour show the same thing – the lower and non-skilled workforce are also educated to less than a primary level and living below poverty levels for lack of salaried wages.
The poverty levels of India are shown in the chart below. Here the people live on less than USD $1.25 a day.

Health
Finally we look at health as an indicator of economic progress. With less than 10% of population insured, India has one of the lowest penetration levels of health insurance in the world. More than 50% of Indian healthcare spending is an ‘out of pocket’ expense, implying a serious risk to poor households who have to borrow money at exorbitant rates to pay for treatment.
Taxation
We now need to look at taxation and what is legally stolen by the government.
Looking at the Indian Taxation Code, the threshold for payment of personal income tax in 2017 is INR 250 000. This means simply that for about 95% of the population in India there is no need to pay personal income tax. However the indirect taxes are high and we are not considering other types of taxation in our study.
Conclusions on the Indian Economy
Based on the information collected above, a few general conclusions can be drawn about the economy.
(a) The GDP graph and the import / export charts identify that the major causes of the decrease in CAD were the drop in oil prices and the increase in exports from the services sector. It is important to also note these are two conditions that are outside India’s control. The GDP without a services sector growth fuelled by U.S. outsourcing and higher oil prices should show an unhealthy CAD, which could happen if there was a political or economic policy shift in the U.S, a rise in oil prices or a global trade slowdown.

(b) Generally about 51% of households live below INR 128 000 per year with one wage earner or less. About 95% of the population have at most a secondary education and are living at most on INR 146 000 per year per family. The remaining 5% of the population possibly have higher education with earnings about INR 600 000 per year or higher.
(c) Living wages per individual in India is at INR 150 000 per year in 2016 –which means 97% of the population is living below minimum wage with no real increase in wages year-on-year for 75% of the total workforce. This is not fully accurate but will serve our purposes.

The taxation conclusions is validated by official statistics from the Indian Tax Office for the assessment year 2012-13.
A total of 28.7 million individuals filed income tax returns for 2013, but 16.2 million of them did not pay any tax — leaving the number of taxpayers at just about 12.5 million which was close to one per cent of the country’s total population of about 1.23 billion.
4. The Shadow Indian Economy – A Question of Survival
There is an important aspect of Indian life that exists from their ancient times – the ‘shadow’ political and economic structure that co-exists side-by-side and within the official political and legal framework of the State. This shadow reality is able to meet the basic requirements of most Indians and ensures their survival in the most difficult of times without relying on the banking system or the government.
It has never been proven that the shadow economy and that related cash flows are illegal – Indian companies are reportedly misusing public trusts for money laundering. This is a claim only. The real claim is that all assets outside the control of the financial system are illegal.
Usually the agricultural sector (53%), the construction sector (11%), the industrial sector (11%) and transport (4%) – which is about 79% of the population – is the basis of this economy. This is close the lower economic class of 77% approximated by the Asian Infrastructure Bank and consistent with the population – wage trend of 78% with at least one non-salaried worker. Of the remaining 22%, only 3% are the upper class and the remaining 19% are the ‘educated’ middle class (as in having a passable education and a job).
The shadow economic wealth is estimated at 30% (total) and 15% (currency + gold) of GDP. This translates to INR 44 trillion for and INR 22 trillion respectively.

Assuming that all these assets owned by the 78% generate wealth that is required to be taxed as the income is illegal – as the government claims, this will not change the ‘not taxable’ status of the people owning these assets – hence they are not doing anything illegal. A quick calculation will prove this.
Example : Let us add the wealth generated by these assets to the wages of the people in the shadow economy say earning INR 146 000 per year – there should be a proportional gain of 30% to their current salary as the assets are 30% of GDP.
A INR 146 000 per year per family x 1.3 = INR 189 000 per family after any wealth gains. This is well below the tax threshold of INR 250 000 per person. There is no illegal tax money withheld as the government claims.

There is a trade and barter system under the shadow economy similar to how a financial system functions, but this is usually below the tax thresholds for people doing business under this system. VAT (Consumer Tax) is not required for their small businesses with an annual turnover of less than INR 500 000. Therefore the shadow economy is not illegal as no laws are being broken. There are schools, clinics and other essentials funded at the village level that the government gives no money for.
India has among the highest usage of cash and gold across global economies as asset protection outside the banking system. According to a 2015 report from PwC, 98% of all transactions by volume happen in cash. 68% of the total value of transactions is conducted in cash – this is not controlled by banks and is invisible to them.
This is not about criminal gangs using this system – as the government claims. That is not the function of the shadow economy which is used by the general public. Criminal activity is rampant in the mainstream banks, corporations and government institutions that deal blatantly in real black money by money laundering, employing workers below the minimum wage, exploiting them for unpaid work or blackmailing workers of goods and services.
It is interesting to note that in Tea-Seller Modi’s administration there is a blanket policy not to go after these large corporations and state –run sweat-shops.
The use of the shadow economy by the large majority in India is not for money-laundering but in keeping legal money out of the banking system and converting it into real hard assets and gold – which is not a criminal offence. This deprives the real thieves in the banking system of capital and therefore there is a push to eradicate this alternative economy.
Conclusion
In this part I gave reasons why the Indian economy had fundamental weaknesses despite its GDP and Current Account standings. The stronger GDP and lower CA are based on the strength of only one foreign-dependent services sector and from lower oil prices – this is not a good sign in terms of proper growth. These earnings can be lost anytime.
The majority of the households in the agricultural and industrial sectors are making ends meet in an unbalanced economy. These sectors are in high debt to the banking sector.
A shadow economy – separate from government institutions and the financial system – has been maintained along traditional lines to ensure the people’s survival.
In the next part I will look at the Indian banking system, reasons for de-monetisation and why it was enforced in this manner.
END OF PART II

Anonymous0Lots to think about there, Yumbo!
I don’t claim to understand all of it but I do understand that the people devised a way to keep their government out of their pockets and now the government is taking steps to get at their money. What do you see as a possible outcome? Possible solution?
Keep up the good work!Import of manufactured goods that includes 80% of India’s oil is a consequence of legacy industrial production with a proportion of 27% of GDP to 22% of the population. Petroleum crude and oil-based products have been driving the imports and have risen by 22% in the past 5 years. Additionally from 1987 the value of non-petroleum import goods have increased by nearly 27-fold but major exports have only increased by 20-fold.
This is what is going to destroy the India economy. As the India currency becomes worthless for those with the old currency in hand, the India currency on the global markets is devaluing against other currencies.
Not only will prices on imported goods and fuel go up, but the money the India people have on hand will not be accepted. Thus destroying the India currency twice over.
This is an economic death spiral. And given India has a population of 1.2 billion people, the repercussions will be felt across the world.
Brother Yumbo,
You should be writing for somebody as a paid author.
Love is just alimony waiting to happen. Visit mgtow.com.
Lots to think about there, Yumbo!
I don’t claim to understand all of it but I do understand that the people devised a way to keep their government out of their pockets and now the government is taking steps to get at their money. What do you see as a possible outcome? Possible solution?
Keep up the good work!Sorry if I put too many numbers and the text may be unclear – I’ve revised it now to make it more readable. What I was trying to show is summarised below.
If you have any questions on what was written (or generally) just post it here and I will gladly answer you in a response.
I will do my best to clear things up for you personally.1. GDP of India (the measure of an economy’s health) – has been made to look like a success story by the Indian Government and MSM. Looking at the overall numbers (GDP, CA, CAD) this appears to be true.
2. Breaking down the numbers tells a very different story. India’s three sectors – agricultural, manufacturing and services – all have very different $ contributions to the country’s GDP. The workers live very differently as a result. About 78% are in bad shape and getting worse.
3. This is an unbalanced situation as resources are diverted to the IT/services sector and not enough to the other two sectors to make things better. The services sector is heavily dependent on work from foreign firms therefore could dry up easily. India cannot sustain itself without this sector. It has done very little to reform the other two.
4. About 95% of Indians do not pay taxes due to the imbalance of wages in the system. They cannot afford proper healthcare or education. They have worked out a ‘shadow’ trade and barter system between themselves that allows them to survive. Whatever money they have is put in this shadow system. They do not trust or need banks for their survival.
5. This shadow system is not illegal for the vast majority of the people in it. The government claims it is illegal as they want that money in the government banks.
A lot of numbers but I wanted to show in more detail the economy and wages to make my points. Again I apologise if this was confusing, Ill do better next time – still learning.
The end result is not easy to see – there are a number of ways this could end – I am still gathering data. I’ll post these outcomes in the final part.
Thanks for reading!
Brother Yumbo,
You should be writing for somebody as a paid author.
Thank you bro. I am happy to write for MGTOW.
I have updated some sections to make this more readable.
Sorry for any unclear content- AuthorPosts

You must be logged in to reply to this topic.

921526
921524
919244
916783
915526
915524
915354
915129
914037
909862
908811
908810
908500
908465
908464
908300
907963
907895
907477
902002
901301
901106
901105
901104
901024
901017
900393
900392
900391
900390
899038
898980
896844
896798
896797
895983
895850
895848
893740
893036
891671
891670
891336
891017
890865
889894
889741
889058
888157
887960
887768
886321
886306
885519
884948
883951
881340
881339
880491
878671
878351
877678